Translate

Sunday, 24 January 2021

Robust chart setup ...!!!

TVSMOTORS : SMOOTH RIDE AHEAD WITH MOMNETUM ... !!! 

This stock has been a laggard for the last couple of years and has remained under pressure from 2018-2020 (April). The stock registered bottom in April 2020 around 250 mark and has seen steady upmove thereafter till 500 levels. However, post that the stock has turned sideways and remained lackluster comparing with its peers.

Technically speaking the stock chart is promising and signals a smooth side ahead with supportive momentum. On the weekly chart, the stock has registered a breakout from a probable V-shaped pattern which is considered to be a bullish trend reversal pattern in nature and signals a trend signal going forward. Also, considering the Price-Volume action is quite bullish and injects further confidence in the trend. The volumes have increased with rising prices which is a bullish sign and complements the bullish view on price.  


The next chart attached is the Ratio chart of TVSMOTOR/CNXAUTO which displays an important pointer to note. The Ratio has been consolidated in the sideways range for the last many months and currently, the ratio has dropped to the Support zone (Highlighted in Green) which compliments a bullish view on price. Also, the momnetum indicator has dropped to a lower trendline of the channel which adds further confirmation that the Ratio likely to hold its previous support zone and to inch higher in going future.


Furthermore, The Auto sector shall witness further strength going forward and likely to outperform the benchmark index in the coming months. The next chart attached below is the Ratio of CNXAUTO/NIFTY which is throwing the bullish signal and indicating the Auto Sector would outperform the Nifty. 


From the above chart, it is evident that the Ratio has been declining from last more than 2 years and at the bottom, the ratio has developed a bullish reversal pattern. The Ratio has formed and given breakout from inv Head n Shoulder pattern which denotes bullish trend for CNX Auto index. The pattern also suggests probably the underperformance with the benchmark index is about to end and going ahead the AutoIndex shall outperform the Nifty. Furthermore, The trend oscillator attached has entered the bullish territory after a good amount of time and has reversed from Neutral reading with a bullish crossover which compliments a bullish view on price.

Thus following the above studies and other Technical tools I believe the stock has further legs to scale higher and in with the support of the Auto Index doing good, shall provide a further push in price momentum to inch higher to towards 580-630-675 levels in short to medium term. In case of any corrective decline, the demand force is expected to emerge around 500-485 levels. While the above view shall void if the price closes beneath 474 levels.

THANK YOU FOR READING !!! IF YOU LIKE THE POST DO SHARE & COMMENT... 
FOLLOW THE BLOG FOR REGULAR UPDATES.
GOODLUCK!

Sunday, 17 January 2021

The Dark Horse !!!

 INDUSTOWER : AT THE CUSP OF NEW BULL TREND... !?!

The stock has remained under pressure and in the Bear market for the last 3 years. The bears showed no mercy on bulls and every rise in the stock was sold into to form new lows. Stock made a peak around 480 in late 2017 and thereafter the stock has continued to decline and formed a bottom around 120 in March 2020. The bear market in the stock seems to be completed and the leadership of bulls likely to be followed for the rest of the year leading with good gains rally in this counter. 

Technically, there are multiple triggers on the Weekly chart that hint at a change in trend from bearish to bullish. The chart attached below is the weekly chart of IndusTower which highlights that stock was trading in the Descending channel when the stock was under the shadow of bears and that Channel witnessed a decisive breakout in Nov 2020, which indicates a bullish trend for medium-term trend. 

After forming a bottom around 120 levels, the stock has found a major hurdle around 235-245 zone which got conquered a few days back and the price has been comfortably trading above the same with bullish momentum and supportive volumes which suggests strength in price and compliments bullish view on price. 

From the above chart, it is evident that the stock has surpassed two major hurdles which hint there is a high probability that the good movement in price yet to come and fruitful gains shall be delivered in the coming months.

The other chart attached below denotes the Dow Theory which helps to understand the trend in security. To explain in simple words, When price forms Lower High and Lower Lows is signifies Downtrend whereas Higher Highs and Higher lows signal Uptrend or bullish trend in price. In this counter, the stock has surpassed its previous swing higher and has formed a Higher high and without breaking its previous major low, which means the price has formed a Higher low and Higher High which denoted a probable bull trend in the stock.


From the above chart, it is visible that the earlier price was forming a series of Lower Highs and Lower Lows and Recently that series has broken and the price has begun forming Higher Lows and High Highs which signifies a bullish trend in the stock.

The next chart focuses on Leading Indicators and My Moving Average Band (M Bands). The Indicators are well trading in Bullish Territory which signals Momentum in trend. The Moving Average Band which was acting strong resistance earlier is now providing strong support to the price which hints at the strength in trend.  

Thus following the above studies and Technical tools I believe, A New Bull run in stock about to begin, and bullish momentum likely to be followed for the coming months. The stock has the potential to resolve higher and head towards 300-345-410 levels in a short to medium-term time horizon. In case of any corrective decline, the demand force is expected to emerge around 251-242 levels. The above-mentioned view negates if price fails to produce upthrust momnetum and closes below 229. 


THANK YOU FOR READING !!! IF YOU LIKE THE POST DO SHARE & COMMENT... 
FOLLOW THE BLOG FOR REGULAR UPDATES.
GOODLUCK!!


Sunday, 10 January 2021

Price and Volumes breakout!

 PRESTIGE - Bulls set to show its power?!? 

The Reality stock has been in strong momentum for the last many weeks and the buzz seems likely to continue ahead. From the Reality basket, I like Prestige Estates which all the ingredients to qualify as a buy candidate with favorable Risk-Reward in place. 

The stock has been on my radar for the last few days and has been tracking closely and now I believe the stock is set to see some decent up move in the coming weeks. The stock has reversed from the confluence of support and has given a breakout with a sharp rise in volumes. Analyzing the longer-term charts, the stock has been trading and seems following one of my favorite patterns which I like to focus on.

The chart attached below highlights that stock has been trading in the Parallel channel for the last many years. The stock forms a significant bottom and top near the channel trendline and Median line trends to provide the support/resistance depending upon the trend. The present trend with a perspective of short to medium term seems bullish and the Median line is acting as an important support for the stock price. If History tends to repeat (which in my view it will) price likely to scale towards the north to test the higher trendline of the channel.


The next chart attached shows how 20WEMA has provided strong support earlier and dip in price has arrested near the same. Also, the recent up move has led the price to surpass above 50% retracement levels of its previous decline with a sharp surge in volumes and formation of bullish wide candlestick pattern which adds confidence in the price action. Furthermore, the price has recently reversed taking support at an upsloping trendline which adds further support to the price.  

For the last many week's prices has been consolidating near Magic Bands (Green Colour) and has provided strong support to the price. From recent price action, it seems the consolidation is completed or the price has gathered the strength and is set to rally higher.


The below chart is the Ratio chart of Prestige Estate & Nifty Realty index, which Signals the Ratio has dropped to an important support zone from where the Ratio has inched higher historically. The ratio chart also compliments the bullish view on price and hints Prestige Estate likely to outperform its index. The overall price structure has been also throwing the same signal as discussed above.


Thus following the above studies and Technical Tools I believe the stock has more leg to rally on the higher side. The short and medium term charts denote good strength in price and bulls likely to take the charge going forward. The levels on the higher side to watch out 330-355-390. On the lower side support is visible around 280-268. The above-mentioned view voids if the price closes below 259.


THANK YOU FOR READING !!! IF YOU LIKE THE POST DO SHARE, COMMENT, AND FOLLOW THE BLOG FOR REGULAR UPDATES.
GOODLUCK. 

Sunday, 3 January 2021

Stock to watch for 2021 !!


STOCK TO WATCH FOR 2021 - TATA MOTORS 

After years of underperformance, I believe 2021 would be the year for TATAMOTORS. From the last 4 years stock has remained under the shadow of bears and every rally has been sold into to make series of lower lows. Following the chart structure and price patterns, I believe the stock shall break its underperformance and pass on the baton to bulls from bears, which took hold on for the past 4 years. 

The weekly chart attached below highlights that, the price registered a decisive breakout from the Descending resistance trendline which has proved strong resistance earlier for the stock price. This trendline has acted as strong resistance for the price in the last four years. 


The breakout occurred for the first time in late August 2020, and post that price formed a Multi-week base formation at the trendline which acted as strong support or the price. The breakout accompanied by decent volumes which compliments a bullish view on price. The breakout from base formation confirmed a change in the ongoing bear phase. The recovery from the bottom was well supported by strong volumes comparing to its historical instances which inject more confidence in the rally. 

The next chart attached is the monthly which showcases some interesting time symmetry in the earlier up and downtrend phases. For better understanding, I have shaded Large, Medium, and Small trends phases with different colors and have marked A, B, and C. 


From the above chart, it is evident that The Large Uptrend continued for 42 bars and then saw a sharp decline. Similarly, the downtrend also took 42 bars (this symmetry voids if price makes a new low). Another instance is of a Medium-term trend which is highlighted in Red color and Marked as B. The sharp decline took 7 bars and the same uptrend got over in 7 bars. The minor trend Shaded with Balck and marked as C. Where up move held for 2 bars and completed in 3 bars. Thus the discussed time symmetry suggests that the Large downtrend phase is likely over and uptrend shall continue for many months.

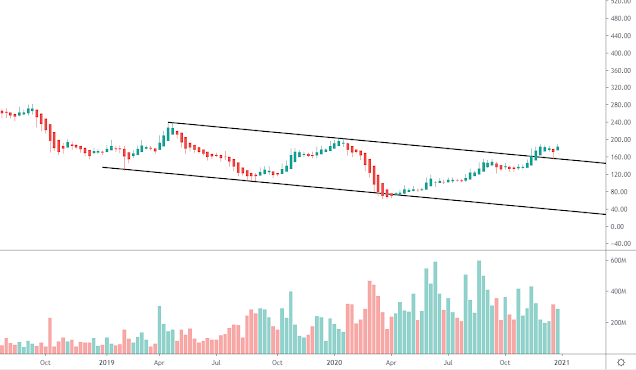
The last chart shown below is the weekly chart focusing on the price action of last year. The stock saw trading Downsloping parallel channel which continued for many months and recently stock registered breakout from the same which signals bullish signal for short to medium trend. Post breakout from the same price rallied higher for few days but soon witnessed profit booking draging prices lower to restest the higher trendline of the channel.


Thus following the above studies and Technical tools I believe stock has more leg to rally on the higher side. The medium and long charts signal good strength in price and bulls leadership shall continue ahead for many months. The levels on the higher side to watch out for 235-280-330. On the lower side support is visible around 177-168 levels. I would review my analysis and be cautious if the price closes below the recent low i.e. 155 levels.


Do share your thoughts in the comment section and If you agree do Like, comment and follow the BlogPost. 
Do share your stock pick for 2021 which you think will be the winner in 2021 !!!

Thank you for reading. Wish all the readers a Happy, Prosperous, and Wealthy 2021..... !!!
Good Luck.


Disc. The above-shared analysis is solely my view as per my understanding and knowledge and for educational purposes. I will not be responsible for any loss or gain incurred.