STOCK TO WATCH FOR 2021 - TATA MOTORS
After years of underperformance, I believe 2021 would be the year for TATAMOTORS. From the last 4 years stock has remained under the shadow of bears and every rally has been sold into to make series of lower lows. Following the chart structure and price patterns, I believe the stock shall break its underperformance and pass on the baton to bulls from bears, which took hold on for the past 4 years.
The weekly chart attached below highlights that, the price registered a decisive breakout from the Descending resistance trendline which has proved strong resistance earlier for the stock price. This trendline has acted as strong resistance for the price in the last four years.
The breakout occurred for the first time in late August 2020, and post that price formed a Multi-week base formation at the trendline which acted as strong support or the price. The breakout accompanied by decent volumes which compliments a bullish view on price. The breakout from base formation confirmed a change in the ongoing bear phase. The recovery from the bottom was well supported by strong volumes comparing to its historical instances which inject more confidence in the rally.
The next chart attached is the monthly which showcases some interesting time symmetry in the earlier up and downtrend phases. For better understanding, I have shaded Large, Medium, and Small trends phases with different colors and have marked A, B, and C.
From the above chart, it is evident that The Large Uptrend continued for 42 bars and then saw a sharp decline. Similarly, the downtrend also took 42 bars (this symmetry voids if price makes a new low). Another instance is of a Medium-term trend which is highlighted in Red color and Marked as B. The sharp decline took 7 bars and the same uptrend got over in 7 bars. The minor trend Shaded with Balck and marked as C. Where up move held for 2 bars and completed in 3 bars. Thus the discussed time symmetry suggests that the Large downtrend phase is likely over and uptrend shall continue for many months.
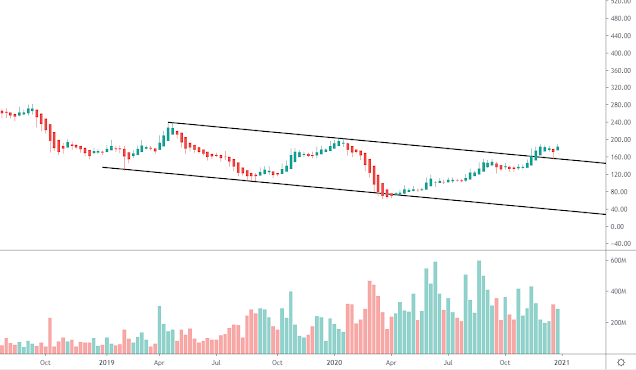
The last chart shown below is the weekly chart focusing on the price action of last year. The stock saw trading Downsloping parallel channel which continued for many months and recently stock registered breakout from the same which signals bullish signal for short to medium trend. Post breakout from the same price rallied higher for few days but soon witnessed profit booking draging prices lower to restest the higher trendline of the channel.
Thus following the above studies and Technical tools I believe stock has more leg to rally on the higher side. The medium and long charts signal good strength in price and bulls leadership shall continue ahead for many months. The levels on the higher side to watch out for 235-280-330. On the lower side support is visible around 177-168 levels. I would review my analysis and be cautious if the price closes below the recent low i.e. 155 levels.
Do share your stock pick for 2021 which you think will be the winner in 2021 !!!


