Translate

Sunday 27 September 2020

Camlin Fine : Wide Bullish Double Bottom Pattern Breakout !!

Camlin Fine: Attractive Chart setup !! 

This stock does not carry much historical chart data as the stock has been listed a few years back. The stock has been listed in January 2015. However, in terms of five years stock has been languishing in an overall sideways trend. 

So far investors in this stock would have not been much cheerful as the stock has failed to delivered good returns. In around five years stock is still trading near the listing price. However, looking at the weekly chart the medium-term trend looks promising and indicating good upside potential in the stock price can be witnessed. 

The stock registered an all-time high in January 2015 and post that stock has seen a strong decline. In a matter of 9 months stock tumbled to 40 levels from 155 levels. Post forming a low in October 2018 (at 36 levels) stock has been trading in a sideways range. The stock has been oscillating in 50 points range from last two years i.e 35 to 85 levels. 

The long consolidation has emerged out has a Bullish Double Bottom price pattern. The Double bottom pattern is generally considered as a Bullish reversal pattern in nature and signals change in trend from bearish to bullish. This month stock price has registered a breakout from the same with supportive volumes. 


In recent months stock has witnessed. strong and sharp up move taking the price from around 50 to 100+ level. Looking at the strong up move, the price may consolidate here and gather strength for the next potential strong up move.

The Price-Volume indicator attached below is trading well above 0 zero reading and trending higher which is a bullish signal and compliments bullish view on price. 


The stock price is trading above 50,100,200 moving averages which suggest a positive trend and strength in stock price. The momentum indicator attached in the lower panel show indicator has surpassed its previous peak and inching higher which indicates strength and compliments a bullish view on price. 


Following price pattern, volumes, and other technical tools price has the potential to scale higher towards 120-133-150 in the medium-term.

The above view holds true until the price does not close below 84 levels. The strong support is visible around 95-88 levels.


Thank you for reading, If u enjoyed and liked the post do share and comment. To receive the blog alerts on NEW POST, follow the blog.

STAY SAFE STAY HEALTHY !!! 


Disc. The above-shared analysis is solely my view as per my understanding and knowledge and for educational purposes. I will not be responsible for any loss or gain incurred. 


Sunday 20 September 2020

Brigade Enterprise : Bullish reversal pattern breakout !!


Brigade Enterprise: Bullish pattern breakout with supportive volumes and momentum !!


This stock witnessed a fantastic upmove from Nov 2018 to Feb 2020. This stock would have delivered handsome returns to the investor who would have invested in that bull run period. The stock formed a bottom around 104 in November 2018 and made a peak in Feb 2020 around 255. 

However, Post strong and steady rally for almost about One and Half year, price registered Top in Feb 2020 and post that saw a sharp decline towards the level of 91 mark. In just three months time interval stock lost all its earlier gains and bought back price to the level of November 2018.

The stock reversed strongly from the support area of 95 levels and from thereon every dip in price has bought into. The stock started forming more wide bullish candles compared to bearish candles which hint bulls dominance over price.

In this process, the Stock price made a beautiful probable inverses Head and Shoulder pattern which is considered to be a bullish reversal pattern in nature. A few weeks back price registered a decisive breakout from the same with the formation of wide bullish candle and sizeable volumes. 


Post breakout price witnessed minor profit booking and dropped the price to retest the neckline of an inverse head and shoulder pattern. Stock price reversed retesting the neckline and formed bullish candlestick pattern signalling bulls back with force and the prior trend likely to resume. 

Another chart attached below highlights the action between price and volume in the course of sharp decline and recovery. The First Box (Black) focuses on the sharp decline in price with fewer volumes (small volumes bars) whereas, the second box (Green) marks a recovery phase from the lower level which sees an aggressive rise in volumes bars with the price. This hints probable big players are still in the game and recently over the course of upmove shall have added further with an increase in price. 


The next chart attached below displays the momentum indicator below the candlestick chart. After a decent amount of time, the indicator has turned from Red to Green which is a bullish signal and compliments bullish view in price. 


Also, the stock is trading above all major Exponential Moving Averages (9,20,50,100,200) which suggests a bullish trend in the stock price in all time frames i.e from short term to medium term.

Following price action, volumes and other technical tools price has the potential to scale higher towards 200-220-245 in the medium-term.

The above view holds true until the price does not close below 152 levels. The strong support is visible around 167-161 levels.


Thank you for reading, If u enjoyed and liked the post do share and comment. To receive the blog alerts on NEW POST follow the blog.

STAY SAFE STAY HEALTHY !!! 


Disc. The above-shared analysis is solely my view as per my understanding and knowledge and for educational purposes. I will not be responsible for any loss or gain incurred. 


Sunday 13 September 2020

BAJAJ ELECTRICALS : SMALLCAP STOCK TO WATCH 0UT FOR !!


BAJAJ ELECTRICALS: MULTI MONTH DESCENDING CHANNEL BREAKOUT !!


This stock has witnessed a tremendous rally from Feb 2016 - April 2018. The stock saw a whopping northward move that period rallying almost from 150 to 700 approximately. That is an extremely strong move and definitely would have been cheerful for investors and traders 

Post a sharp up move, stock price topped out in late April 2018 and thereafter every rally in stock was sold into. The downtrend continued for almost more than 2 years. The stock started forming Lower highs and Lower lows formations which determine a bearish phase in the stock. 

In the bearish phase stock erased more than 75% of the gains which it had delivered in the bullish period. The stock almost plunged to the level of 250 from 700 levels. The stock made a bottom in April 2020 and post that stock has started forming Higher highs and Higher lows which signals a bullish trend in stock price.

From the chart attached below, it is evident that how price beautifully traded in Descending parallel channel when the price was in bears grip. The price made a bottom exactly at the lower end of the channel and thereafter a sharp rally which lead to gave a breakout from the long Descending channel which hints for a trend reversal in price action.


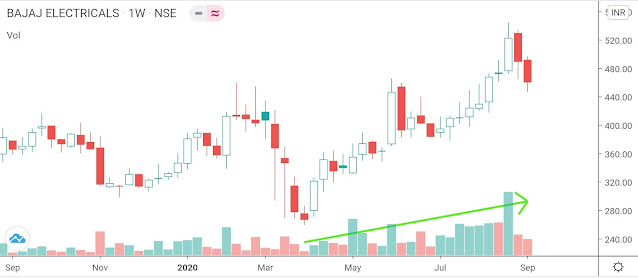
The breakout from the Descending channel was supported with volumes that provide further confirmation in price action. Also, the rally which took placed from the bottom has been well supported by volumes. The volumes bars size started to increases with increases in price which hints for a strong and genuine rally.

Recently, the stock witnessed a healthy correction in price which lost almost 100 points from the swing peak. The important point to note hear is, the volumes have been below average compared to prior bars which signal exit or profit-booking by retailers and big hands are still in the game.


The stock price has been trading above all major moving averages which suggest bullish trend in stock trend and dips towards the support shall be utilized as a buying opportunity.

Currently stock has placed near its previous horizontal resistance area (450 - 430) which also compliments with intermediate upsloping trendline support (Around 420-425). 

Following price action and volumes and other technical tools price has the potential to scale higher towards 540-610-700 in the medium term.

The above view holds true until the price does not close below 400 levels. The strong support is visible around 460 - 424 levels.


Thank you for reading, If u enjoyed and liked the post do Share, Comment, and Follow the blog.

STAY SAFE STAY HEALTHY !!! 


Disc. The above-shared analysis is solely my view as per my understanding and knowledge and for educational purposes. I will not be responsible for any loss or gain incurred.