
Brigade Enterprise: Bullish pattern breakout with supportive volumes and momentum !!
This stock witnessed a fantastic upmove from Nov 2018 to Feb 2020. This stock would have delivered handsome returns to the investor who would have invested in that bull run period. The stock formed a bottom around 104 in November 2018 and made a peak in Feb 2020 around 255.
However, Post strong and steady rally for almost about One and Half year, price registered Top in Feb 2020 and post that saw a sharp decline towards the level of 91 mark. In just three months time interval stock lost all its earlier gains and bought back price to the level of November 2018.
The stock reversed strongly from the support area of 95 levels and from thereon every dip in price has bought into. The stock started forming more wide bullish candles compared to bearish candles which hint bulls dominance over price.
In this process, the Stock price made a beautiful probable inverses Head and Shoulder pattern which is considered to be a bullish reversal pattern in nature. A few weeks back price registered a decisive breakout from the same with the formation of wide bullish candle and sizeable volumes.

Post breakout price witnessed minor profit booking and dropped the price to retest the neckline of an inverse head and shoulder pattern. Stock price reversed retesting the neckline and formed bullish candlestick pattern signalling bulls back with force and the prior trend likely to resume.
Another chart attached below highlights the action between price and volume in the course of sharp decline and recovery. The First Box (Black) focuses on the sharp decline in price with fewer volumes (small volumes bars) whereas, the second box (Green) marks a recovery phase from the lower level which sees an aggressive rise in volumes bars with the price. This hints probable big players are still in the game and recently over the course of upmove shall have added further with an increase in price.

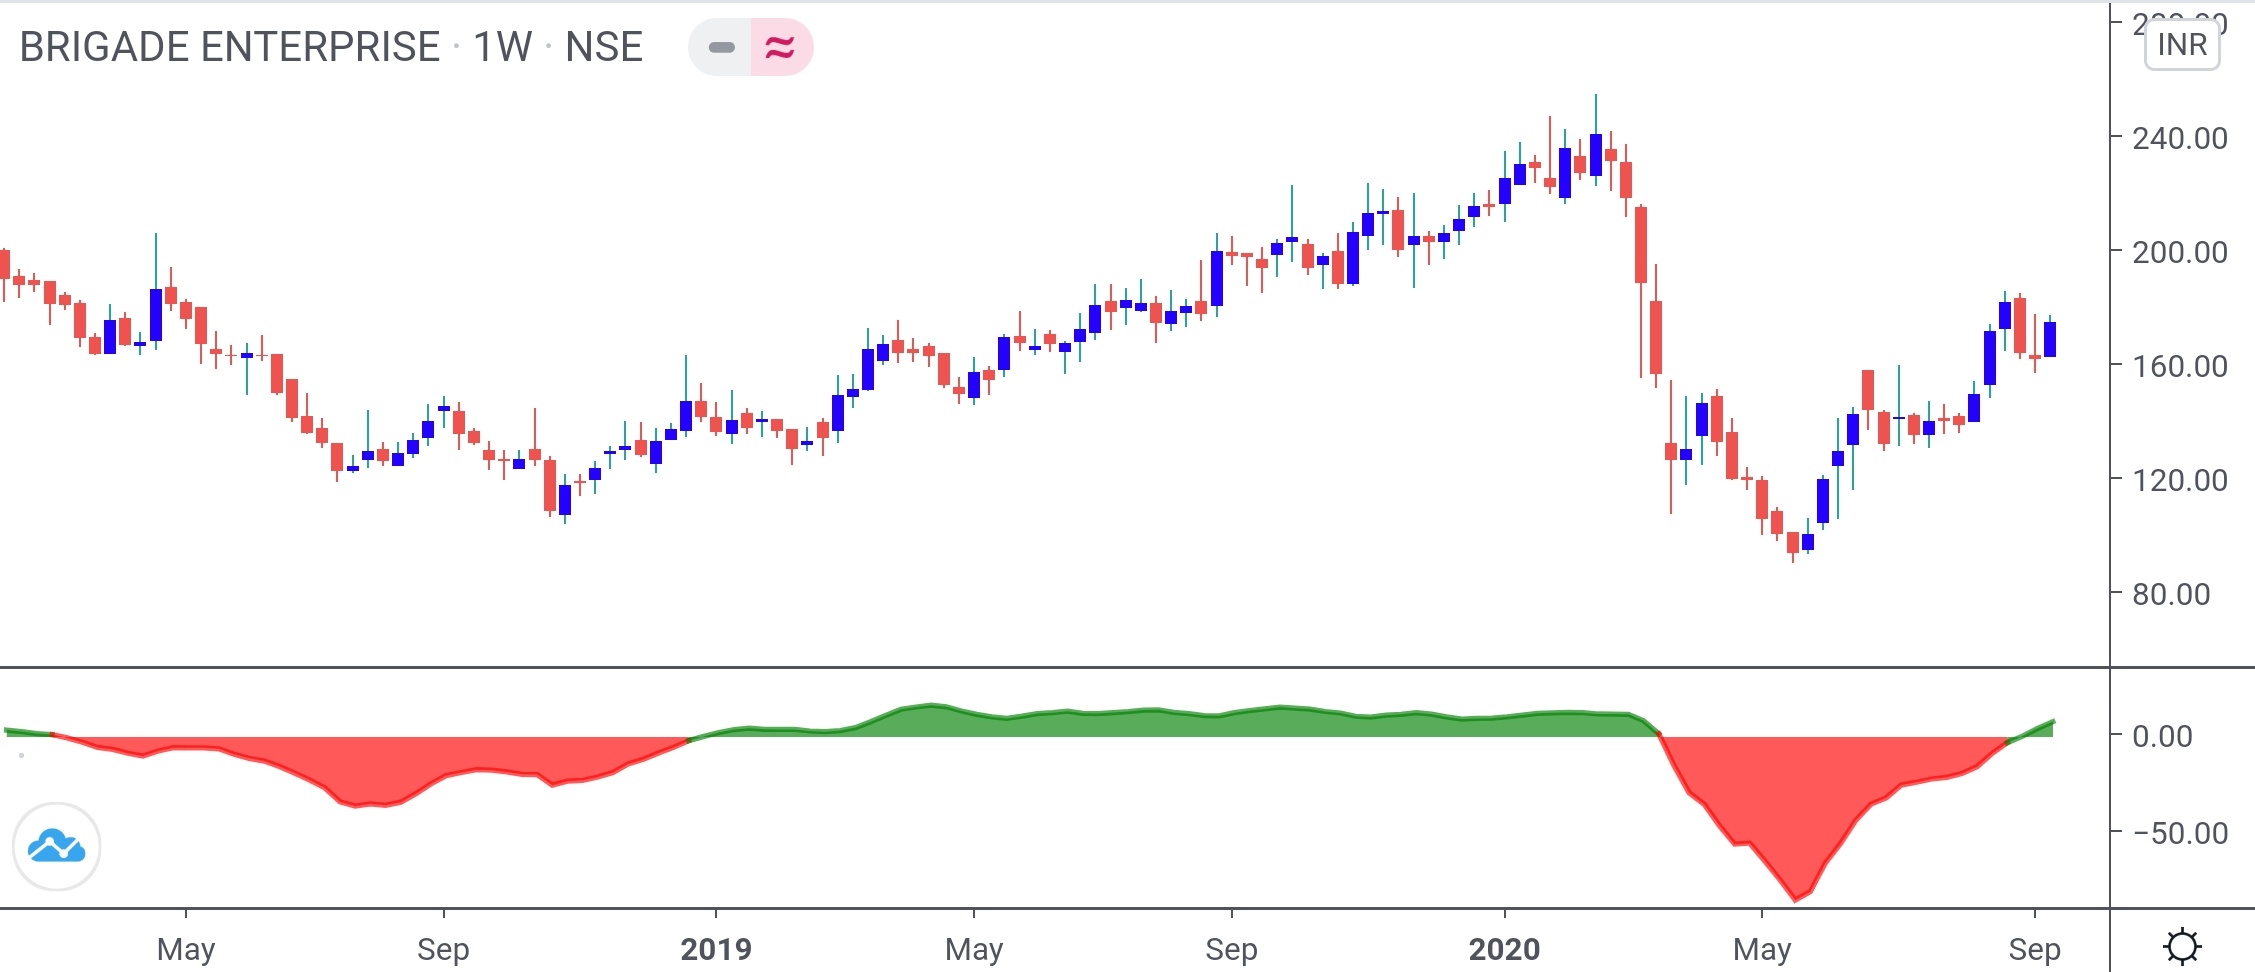
The next chart attached below displays the momentum indicator below the candlestick chart. After a decent amount of time, the indicator has turned from Red to Green which is a bullish signal and compliments bullish view in price.
Also, the stock is trading above all major Exponential Moving Averages (9,20,50,100,200) which suggests a bullish trend in the stock price in all time frames i.e from short term to medium term.
Following price action, volumes and other technical tools price has the potential to scale higher towards 200-220-245 in the medium-term.
The above view holds true until the price does not close below 152 levels. The strong support is visible around 167-161 levels.
Thank you for reading, If u enjoyed and liked the post do share and comment. To receive the blog alerts on NEW POST follow the blog.
STAY SAFE STAY HEALTHY !!!
Disc. The above-shared analysis is solely my view as per my understanding and knowledge and for educational purposes. I will not be responsible for any loss or gain incurred.