Translate

Sunday 28 February 2021

One smallcap $tock to watch out for !!!

TRIVENI ENG - PROMISING CHART SETUP !!!! 

The stock witnessed a multifold rally in Jun 2015 - Aug 2017, in this period price rallied from 15 to 105 which is a phenomenal move for the stock price. However, after that stock failed to continue its outperformance and the trend turned bearish. After printing the high in Aug 2017 and till present, the stock has done nothing in terms of return. The stock has been languishing in the sideways range for the last 2 years. The long underperformance in the stock price is likely to end and the stock shall commence a strong uptrend in the coming months.

The chart attached below is the weekly chart of Triveni which demonstrates the stock price was trading in prolong probable Triangle pattern for the last 5 years. The stock registered a decisive breakout from the same with the formation of a wide bullish candle and surge in volumes which is a bullish signal and compliments bullish view on price. If the pattern unfolds as per the expectations, the price has the potential to challenge its previous Multi-Year high of 108 levels. 

The breakout from the upper trendline has occurred after multiweek consolidation near the higher of trendline which increases the reliability of the breakout and adds more weightage to the resistance trendline. 

Another chart attached below focuses on the price pattern for better clarity and understanding of the price action. From the chart, it is evident that price has been consolidating in the wide range of 50-55 points i.e from 30-85 levels for the past 3 years. Also, from last many weeks price seen trading in rectangle pattern near the upper end of the wide range which hints price seems gathering the strength for the up move to commence. However, the previous peak price made a strong attempt to break the ceiling and enter into the new trading range. For further confirmation of the breakout, I have used the Heiken Ashi candle instead of the Japanese candlestick. Going forward it is significant for the stock price to provide follow-up action and price to close above the wide range in the Heiken Ashi candle. 

The next chart attached displays the Indicators which helps to identify the Volatility, Momentum, and Strength in stock trend.
The chart shows price has registered Bollinger Band squeeze breakout on the higher side which signifies volatility expansion on the higher side which compliments bullish view on price. Furthermore, MACD has reversed from the neutral zone and has given a bullish crossover which is a bullish signal and indicates momentum in price. The last indicator is the ADX indicator with DI+/- lines, which denotes, earlier DI+ has given upward crossover to DI- line and has reversed from 20 levels with ADX line facing northward which indicates strength in price. 

Thus following the above technical studies, I believe the stock likely to attach fresh momentum and gather more strength as the price surpasses and closes above 90 levels. As discussed above the stock has the potential to challenge its previous high of 105levels and above that 128-155 are the next levels to chase in medium to the long term time period. While in case of correction, 83-77 levels showcase the strong support area. Any close below 70 levels, shall negate the above analysis. 


THANK YOU FOR READING !!! DO SHARE YOUR FEEDBACKS. COMMENT YOUR VIEWS BELOW, SHARE FOR WIDER REACH... 
FOLLOW THE BLOG FOR REGULAR UPDATES.
GOODLUCK! 

Sunday 21 February 2021

At the Cusp of Long-Term Uptrend !!!!

Schneider Electric : Bullish Patterns Breakout on weekly chart !!!

The stock had witnessed a humongous rally from Aug 2013 - Jun 2015, where price rallied from 55 to 240 levels. Such a tremendous move was seen in less than 3 years which is an exceptional move for the stock price. However, post that stock has remained under the shadow of bears for about 6 years

The stock gave up all its earlier gains and continued to tumble lower for almost more than 6 years. The long ongoing downtrend seems near the end and the bull rally in the stock shall commence going forward. There are multiple triggers on the charts which are signaling a potential turnaround in the stock trend. 

The first chart attached below is the weekly chart of Schneider Electric, which depicts the stock was trading in a downsloping parallel channel for the last 5 years and it is evident that significant peaks and troughs were formed near the upper and lower boundary of the channel pattern. However, this year the stock registered a decisive breakout from the long downsloping channel which is a bullish signal. 

The breakout from prolonging descending channel has accompanied by strong volumes which provides further confirmation and increases the reliability of the breakout. The volumes have increased significantly in the recent upmove, comparing with other instances which suggest participation by Value buyers or Big players at elevated price levels. 

The other attached focuses upon the recent price action. The recent price action indicates the stock is at the Cusp of giving a breakout from the Double Bottom price pattern. The Double Bottom price pattern is a bullish reversal pattern that mostly forms at the bottom of the ongoing trend and signals trend reversal in the price trend.

The neckline of the Double Bottom price pattern is placed around 115 levels. Thus, for the pattern to materialize well, the price needs to surpass and sustain above the neckline with supportive volumes  If it does, the stock price would register a breakout from dual bullish price patterns on the weekly scale. Also, the MACD line is trading at the highest readings which signifies the strength in price and increases the probability that price would successfully register breakout from the said bullish price-pattern.

The stock had earlier faced a strong resistance multiple times near 200 WEMA and recently the price has surpassed and is sustaining above the same which compliments a bullish signal and strength in price. Also, the stock is trading above 20-50-100 WEMAs which indicates a bullish scenario in multiple time frames. 

Thus following the above studies, I believe the stock shall gather further strength once stock surpasses and sustains above 120 levels and post that stock likely to showcase bullish trend and should scale higher towards 145-170 in coming months. While in case of correction, the stock has strong support placed around 105-98 levels. Any close beneath 93 levels, will lead to void the above-mentioned view.

-----------------------------------------------------------------------------------

I am pleased to share that my Blog "Technical Opportunity" has been selected and featured in Feedspot, the most compressive list of Top 100 Indian Investment Blog on the internet. 


Get the full list of Top 100 Indian Investment Blogs here : 

Read more about Feedspot :- 
https://www.feedspot.com/fs/about

Sunday 14 February 2021

Robust Chart Setup !!!

DeltaCorp - Multi-Year Descending Channel Breakout...

The stock enjoyed a great bull run from Feb 2016 to Jan 2018, where price rallied from 50 to almost 400 levels. This tremendous rally was got arrested around 400 levels in Jan-2018, and from thereon the stock tumbled to the lowest level near 54 levels in March 2020. This means the stock almost gave all its gains which were witnessed earlier in the bull run.

The stock reversed strongly taking support near 55 levels and thereafter stock has seen a steady rally with the formation of Higher Highs and Higher Lows. The stock has so far rallied from 55 to 160+ levels post-printing the bottom in March-2020. However, following the chart set up, it suggests the stock has more room to scale higher in months to come. 

The chart attached below is the weekly chart of DeltaCorp, the prolong down move in the stock price from 2018-2020 was seen trading in Descending channel. The stock traded in the Downsloping channel and it was observed that the significant peak was formed around the higher end of the channel line and the previous bottom formed in March-2020 was also exactly placed near the lower end of the channel line.


The stock continued to trade in the channel for almost more than 2 years and in Dec-2020 price finally registered a breakout from the prolonging descending channel which suggests a bullish signal for the stock for the medium-term trend. Post breakout from the channel price rallied a bit and then saw a minor dip to test and find support near its previous resistance line. The price action hints, resumption in prior trend, and going forward price likely to hold this support zone and witness northward rally in coming months.

The next chart attached focuses on medium-term and short-term chart development to gauge the short term trend. The chart displays Pitchfork lines which are drawn connecting its previous 3 significant swing points (Marked 1-2-3). The price recently reversed taking support at the median line of Pitchfork and with that stock has also given a breakout from the probable Bullish Flag price pattern which compliments the bullish view on price and hints price likely to rally to test the higher line of the Pitchfork which is placed around 220-225 levels and coincides with its previous swing high.


The last chart attached highlights the Price-Volumes behavior and Short term moving average to gauge the trend strength of the ongoing rally so far. The price-Volume action is quite promising and robust. The volume has been above average on the updays while the volumes are lower or below average on the down days on consolidation in price, such behavior generally hints the solid strength in the trend. The price has provided respect to the short-term EMA and recently the small corrections has arrested near the average. Such instances basically show the strength in trend and mostly seen in powerful and well-built trend.

Thus following the above studies and Technical tools. I believe the stock has more legs and to rally higher in the coming weeks to test 177-205-225 in short to medium term time frame. While on the downside the support is visible around 154-146 levels. I would be cautious and review my analysis if the price fails to bring upthrust momentum and closes below 139 levels. 


THANK YOU FOR READING !!! DO SHARE YOUR FEEDBACKS. COMMENT YOUR VIEWS BELOW, SHARE FOR WIDER REACH... 
FOLLOW THE BLOG FOR REGULAR UPDATES.
GOODLUCK!!

Sunday 7 February 2021

Esteem company with strong chart setup.

Godrej Inds - Attractive Chart with favorable Risk-Reward !!!

One of the prestigious and respectable company, Godrej Industries have delivered remarkable returns to their investors and had witnessed multi-fold gains from 2009-2017 period where the price rallied from 50 to 700 levels. However, post such an outstanding rally it is prudent to expect profit booking and the most probable change in the trend. 

The stock topped out in June 2017 around 700 levels and post then the price has remained under pressure and every rally in price has sold into to form new low and develop series of Lower Lows and Lower Highs. The dominance of bears continued till May 2020 where the price dropped from 700 to 230 levels. The stock formed a bottom in early May 2020 and post that stock has reversed strongly. After a strong runup from the low, the stock went into Hibernation mode and seen trading in a sideways range for many months. Looking at the chart set up its seems the stock has gathered the strength and at the cusp to resume its prior rally, which shall be witnessed in coming months.

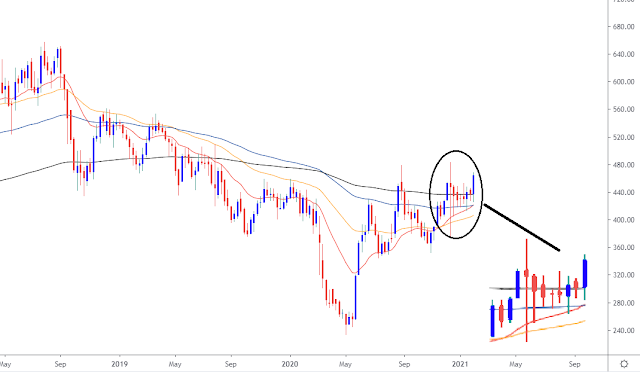
The chart attached below is the weekly chart of Godrej Inds which highlights the breakout from the multi-month selling zone. The stock has experienced strong resistance in the zone of 440-450 levels. The stock earlier made many attempts to surpassed above the same but it failed to do. However recently the stock surpassed above the mentioned hurdle zone and closed above the same which signals strength and compliments a bullish view on price.


Also, the Price-Volumes behavior is robust and promising. The Volumes have increased on the Up-days while on the Down-days the volumes decreased and mostly has stayed below average. Such behavior signifies the Big players are still in the same and aggressive, adding position with the rise in price and Small players are getting out on small knee jerk reactions. 

The next chart attached below displays Multiple Moving averages ranging from short to medium-term time horizon which includes 20-50-100-200 moving averages. 


All the major moving averages are converging near the same juncture and after consolidating for many weeks near Multiple averages, the previous week price witnesses a strong upmove and closed above a multi-week high which denotes strength and momentum in price. The convergence of Moving averages near the same juncture shows strong support for the price. Furthermore, price trading above short to long term averages signals strength in trend.

The next chart attached below focuses on the Technical Indicators to gauge the momentum and strength in price. The first indicator attached is MACD, which denotes the MACD line has entered into the bullish territory after a good amount of time and now MACD inching higher after converging around its average which signifies strength in price. And next indicator attached in the last panel is RSI, which signals the range shift to higher reading levels which indicators momentum and compliments bullish view on price.


Thus following the above studies and other Technical tools, I believe the stock is in good strength and stock to scale newer heights in the coming months. Going ahead, stock price performs as per the expectations the stock shall rally higher to test 510-560-600 levels in short to medium term time horizon. Incase of any corrective decline, the demand force is expected to emerge around 450-435 zone. While the above view shall void if the price closes below 428 levels.

THANK YOU FOR READING !!! IF YOU LIKE THE POST DO SHARE & COMMENT... 
FOLLOW THE BLOG FOR REGULAR UPDATES.
GOODLUCK!!