Godrej Inds - Attractive Chart with favorable Risk-Reward !!!
One of the prestigious and respectable company, Godrej Industries have delivered remarkable returns to their investors and had witnessed multi-fold gains from 2009-2017 period where the price rallied from 50 to 700 levels. However, post such an outstanding rally it is prudent to expect profit booking and the most probable change in the trend.
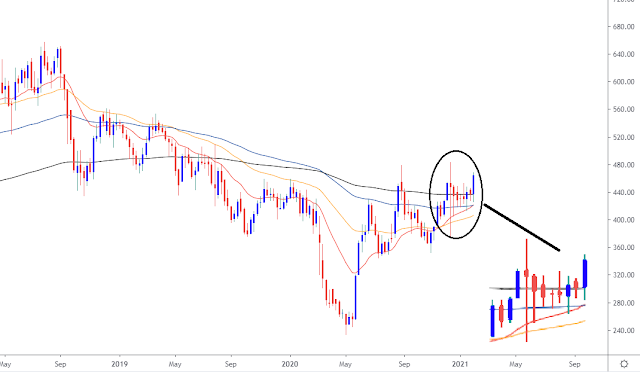
The stock topped out in June 2017 around 700 levels and post then the price has remained under pressure and every rally in price has sold into to form new low and develop series of Lower Lows and Lower Highs. The dominance of bears continued till May 2020 where the price dropped from 700 to 230 levels. The stock formed a bottom in early May 2020 and post that stock has reversed strongly. After a strong runup from the low, the stock went into Hibernation mode and seen trading in a sideways range for many months. Looking at the chart set up its seems the stock has gathered the strength and at the cusp to resume its prior rally, which shall be witnessed in coming months.
The chart attached below is the weekly chart of Godrej Inds which highlights the breakout from the multi-month selling zone. The stock has experienced strong resistance in the zone of 440-450 levels. The stock earlier made many attempts to surpassed above the same but it failed to do. However recently the stock surpassed above the mentioned hurdle zone and closed above the same which signals strength and compliments a bullish view on price.
Also, the Price-Volumes behavior is robust and promising. The Volumes have increased on the Up-days while on the Down-days the volumes decreased and mostly has stayed below average. Such behavior signifies the Big players are still in the same and aggressive, adding position with the rise in price and Small players are getting out on small knee jerk reactions.
The next chart attached below displays Multiple Moving averages ranging from short to medium-term time horizon which includes 20-50-100-200 moving averages.
All the major moving averages are converging near the same juncture and after consolidating for many weeks near Multiple averages, the previous week price witnesses a strong upmove and closed above a multi-week high which denotes strength and momentum in price. The convergence of Moving averages near the same juncture shows strong support for the price. Furthermore, price trading above short to long term averages signals strength in trend.
The next chart attached below focuses on the Technical Indicators to gauge the momentum and strength in price. The first indicator attached is MACD, which denotes the MACD line has entered into the bullish territory after a good amount of time and now MACD inching higher after converging around its average which signifies strength in price. And next indicator attached in the last panel is RSI, which signals the range shift to higher reading levels which indicators momentum and compliments bullish view on price.


Excellent move!! Stocks hits 510++ :)
ReplyDelete